
Look at the line below. Its peaks seem to return on a schedule.
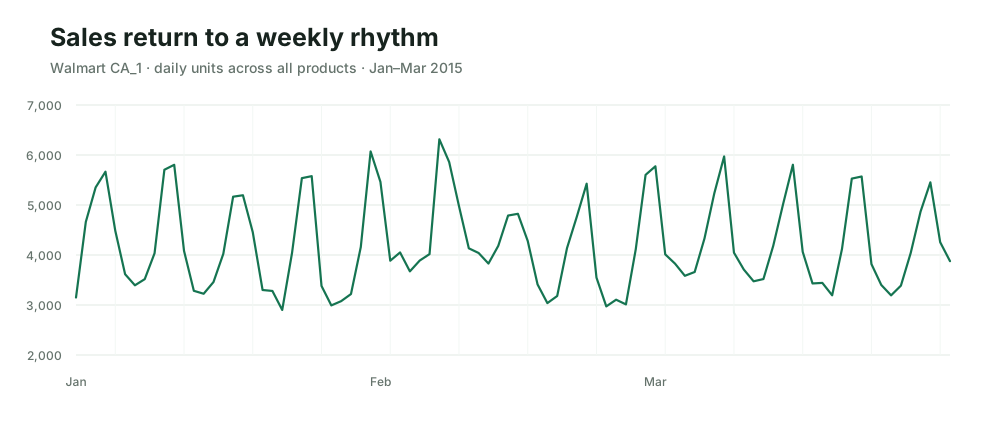
Finding repetition is easy. The harder question is whether an older value tells us something useful—or only looks important because the same pattern keeps repeating.
Knowing the difference helps people who build predictions decide how much history to trust and avoid mistaking an echo for new information.
In the new interactive article, you’ll shift the data through time, uncover the relationships yourself, and build an intuitive understanding of the tools experts call ACF and PACF.